OptiX 5.0 introduces a new post-processing feature to denoise images. This denoiser is based on a paper published by NVIDIA research “Interactive Reconstruction of Monte Carlo Image Sequences using a Recurrent Denoising Autoencoder”. It uses GPU-accelerated artificial intelligence to dramatically reduce the time to render a high fidelity image that is visually noiseless. To understand the impact of this capability on rendering time for interactive use, we measured the performance gains from an AI-accelerated solution.
Hardware
We conducted five rendering tests on two systems. The first four benchmarks were performed on an industry standard 1U server equipped with dual Intel(R) XEON(R) E5-2699 v4 CPUs running at 2.20GHz. We ran the benchmark on the CPUs, then added an NVIDIA Tesla V100 GPU and repeated the tests with AI-accelerated denoising on and off.
The final benchmark was run on an NVIDIA DGX Station, which has 4 x NVIDIA Tesla V100 GPUs and the Tensor Core architecture.
Software & Scene
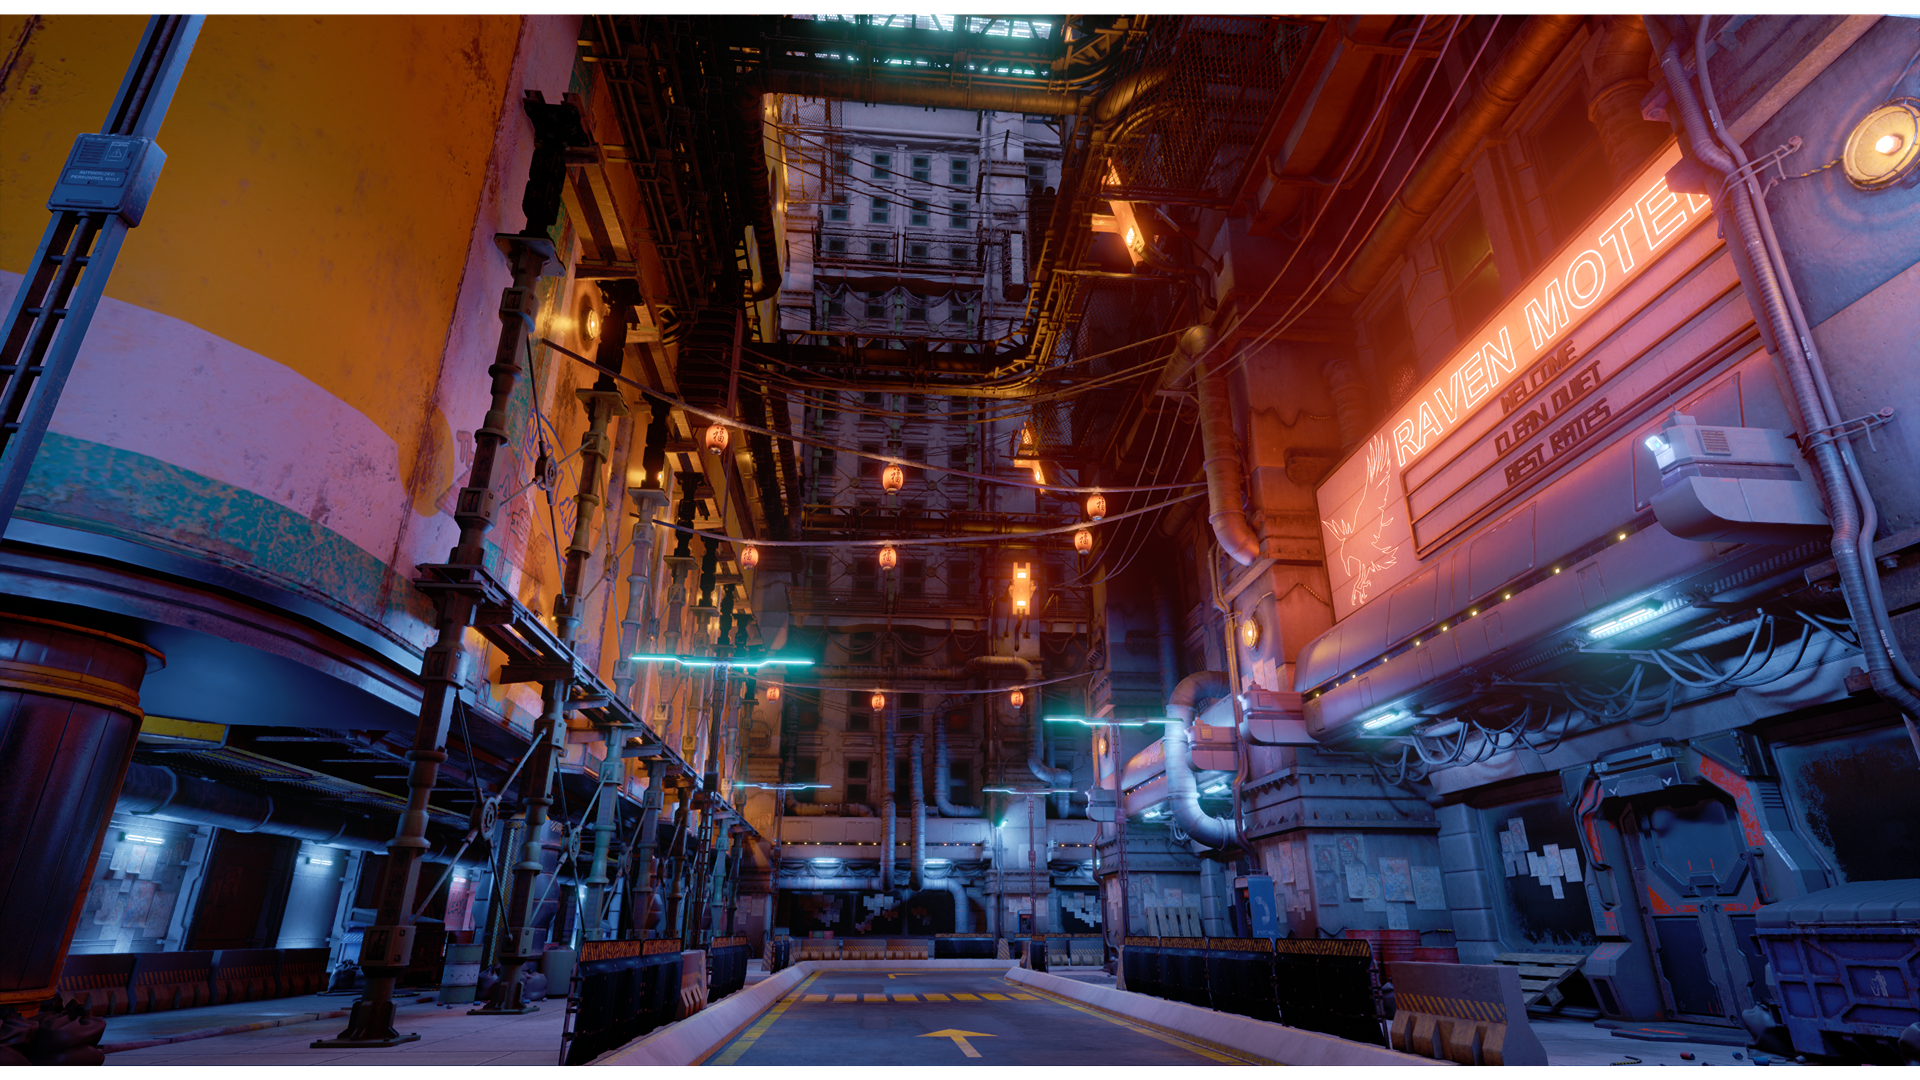
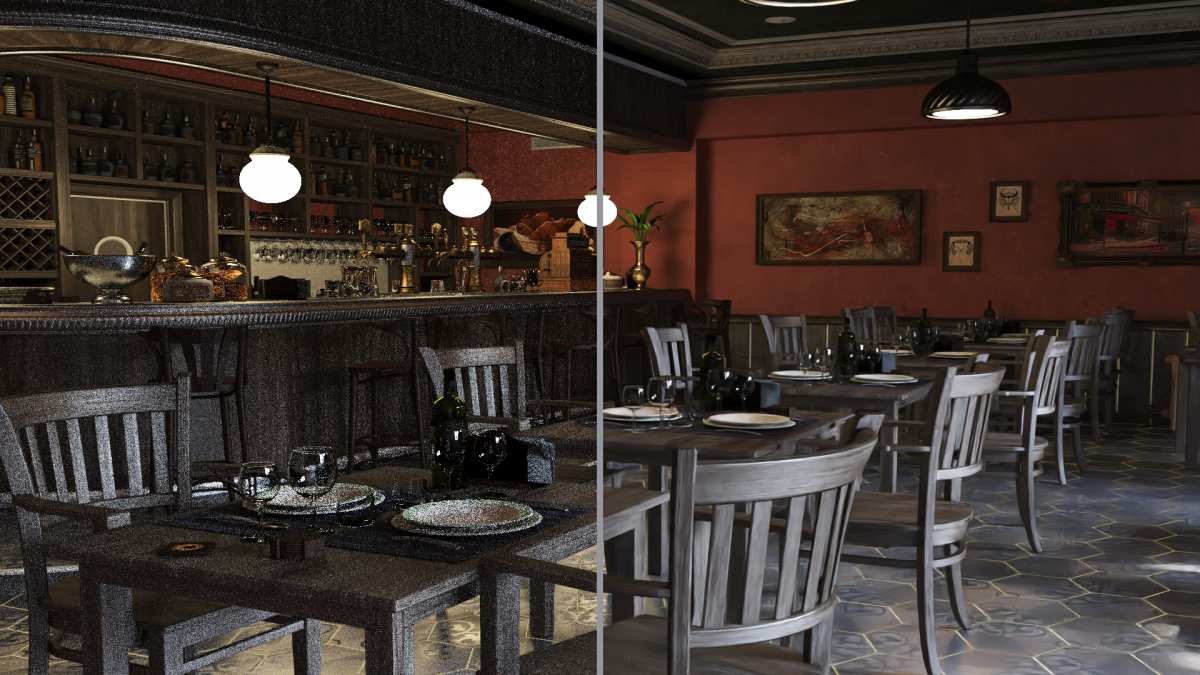
For our performance benchmark we made use of an in-house OptiX based sample renderer and the newly released Amazon Lumberyard Bistro scene available through the Open Research Content Archive (ORCA).
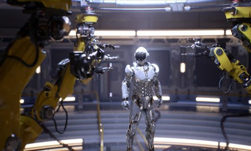
The AI-accelerated denoiser was trained using 1000 CG scenes rendered to 15 different completion levels for a total of 15,000 images using Iray. The training data was given to an auto encoder similar to the one described in the paper. The result is an AI-accelerated denoiser which we will include in the Optix 5.0 SDK. It is important to note that the following tests were performed by our AI-accelerated denoiser on a scene it has never seen and with a new test renderer built on OptiX.

We used SSIM (structural similarity index) as a quantitative measure of similarity between our test image and the perfect image. Our perfect image was rendered using the traditional non AI accelerated algorithm at 1920 x 1080 resolution and 32,768 iterations. We also rendered at 65,536 iterations but that was well past the point of diminishing returns for this scene. Note that in special cases we have seen complex scenes such as the Bank of England project soane benefit from higher iteration counts. For those scenes generating the noise free image using traditional algorithms can require over 65 thousand iterations.
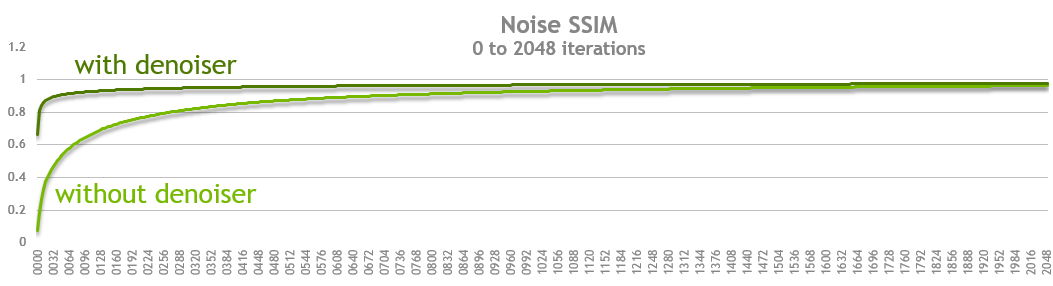
Once we had our baseline (perfect image) we rendered the same resolution image both with and without AI-accelerated denoising for multiple sample iterations and computed the SSIM (Structural Similarity) of each image compared against the baseline image. Below is the resulting table and graph of that data.
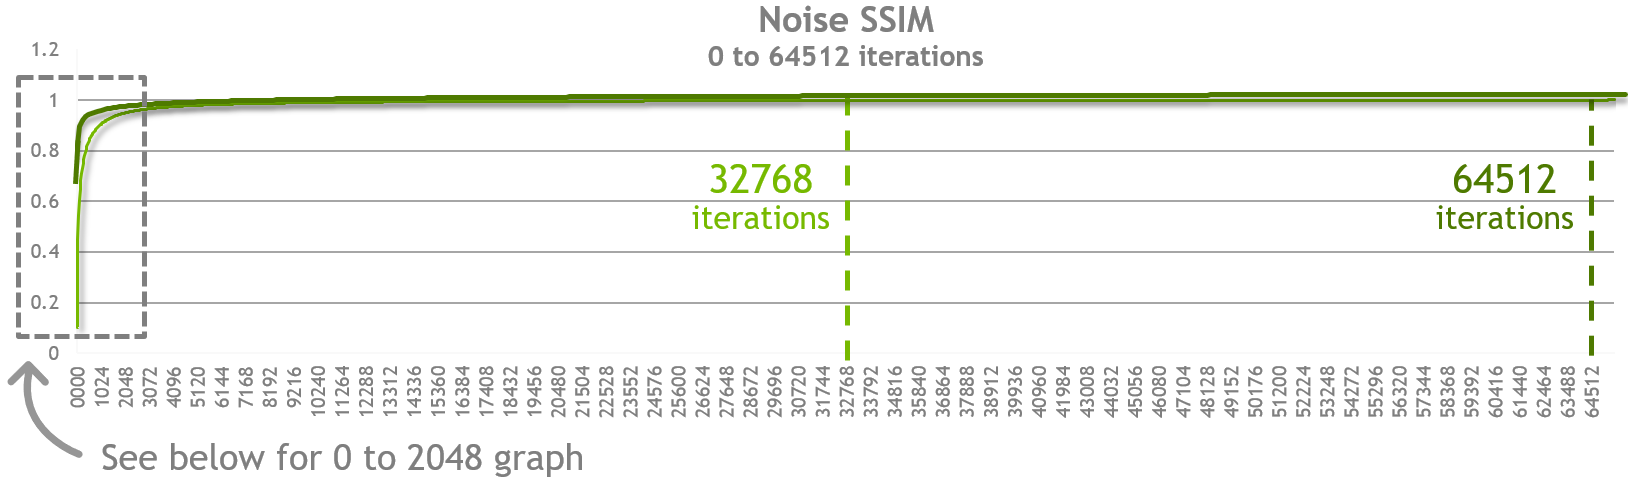
What we can observe in the chart above is that at every sample point (iterations) the quality of the denoised image is closer to the final image we rendered at 32,768 iterations. Moreover you will see that as you approach an SSIM score of 0.99 (or 99% similarity) the two approaches converge.
Defining interactive quality
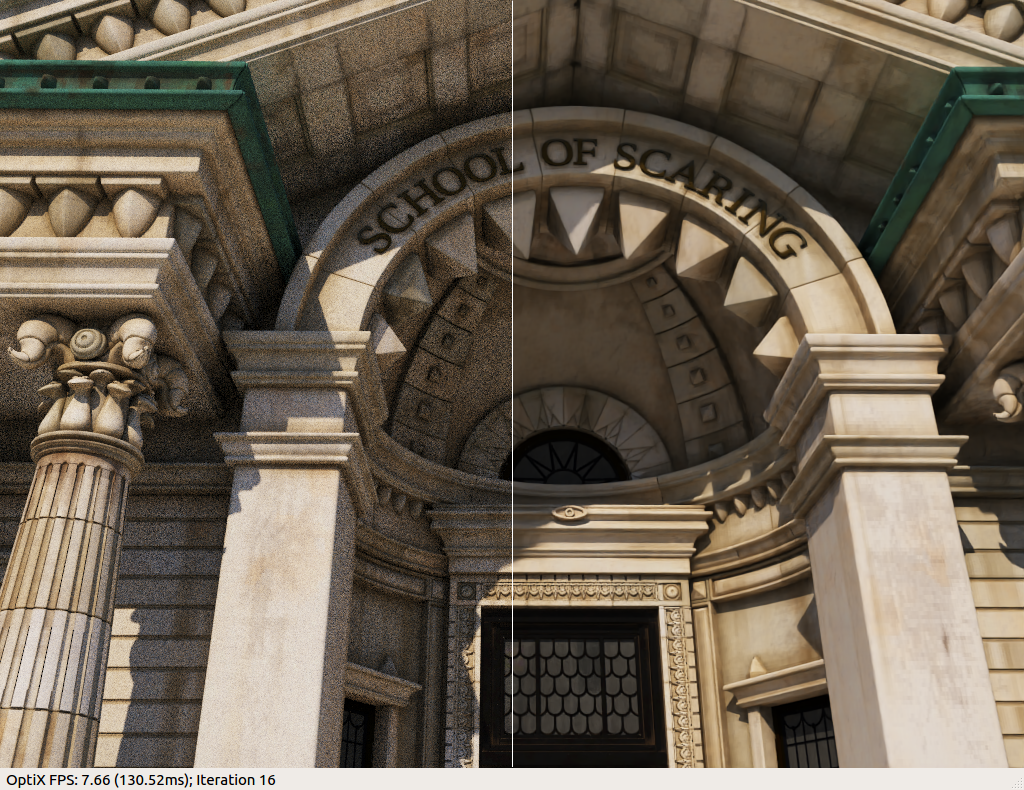
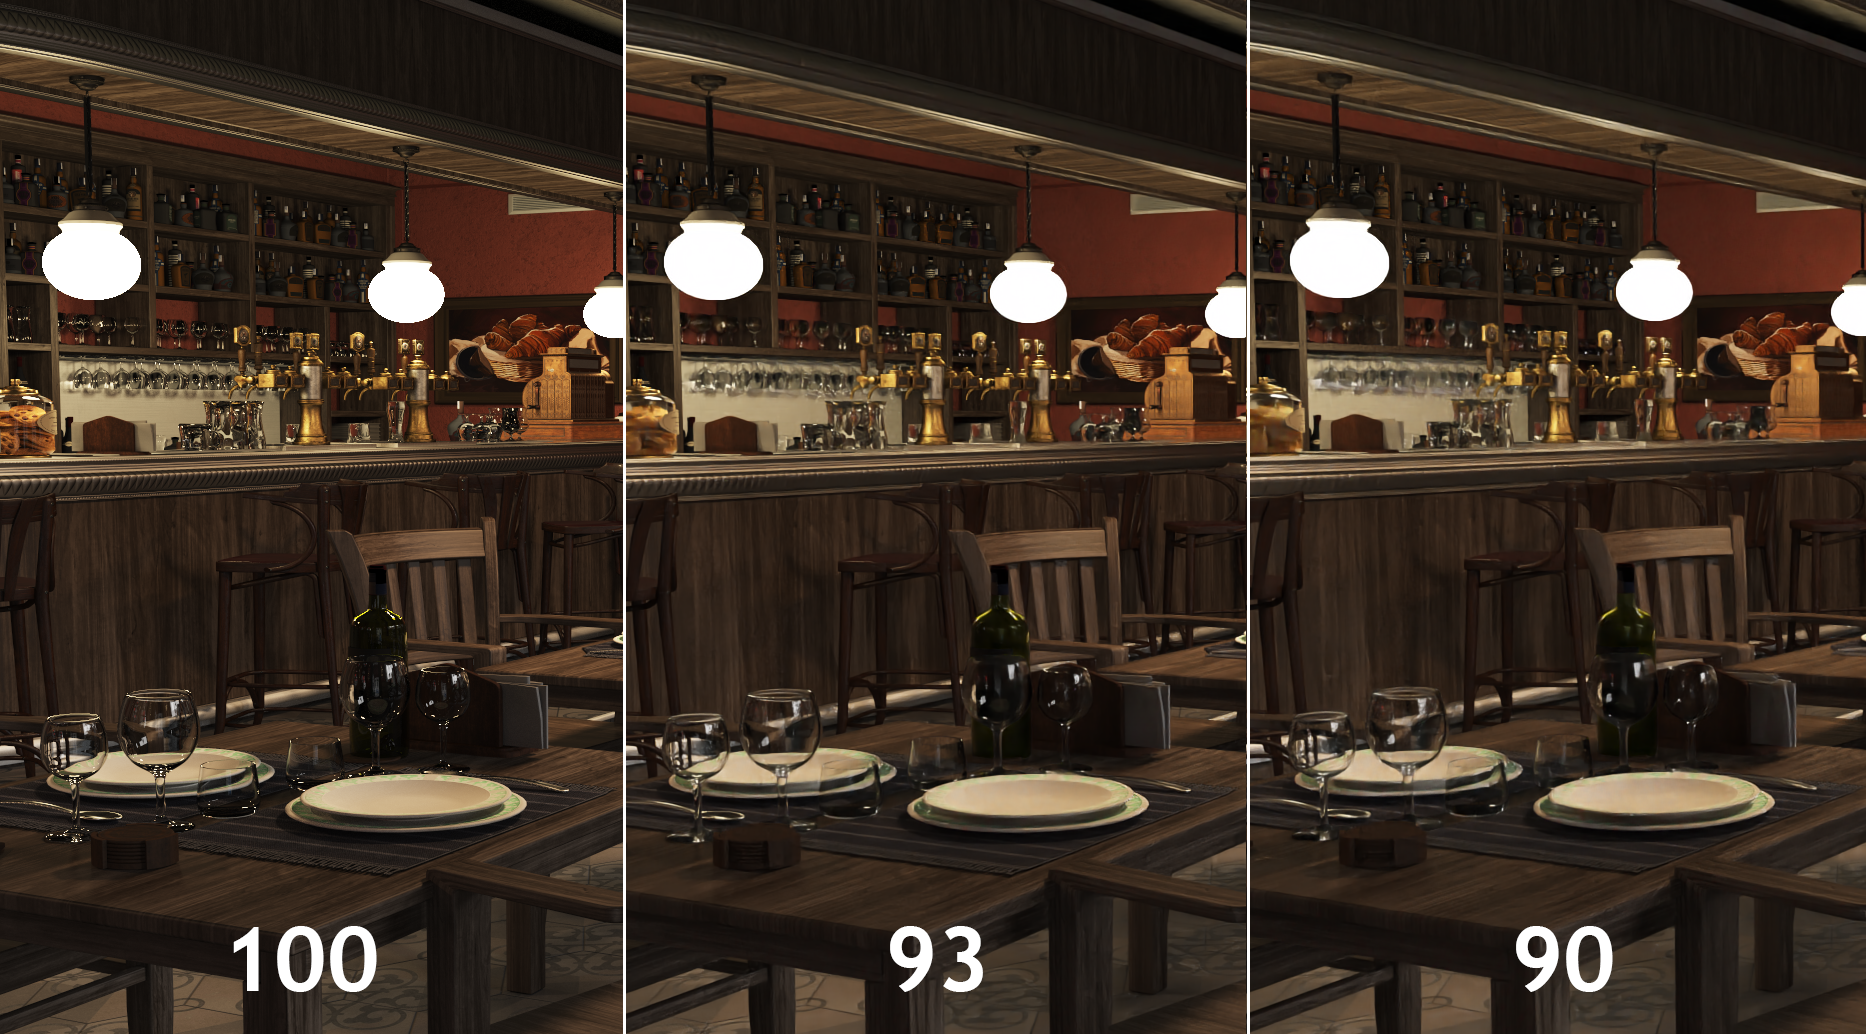
We examined the images and did some qualitative tests with a small sample of creative professionals. The question to answer was at what quality level could they make a creative decision. We tested our subjects with both the bistro scene and a scene from Pixar’s Monsters University and found that images with an SSIM score of approximately 0.90 still contained some artifacts but images with a score of 0.95 were subjectively indistinguishable from the perfect image. For interactive use cases we therefore choose to measure our products on the time it takes to get to an image with a score of 0.93 SSIM when compared to the original perfect image. Note that higher SSIM targets might still be valuable for use cases such as final frame rendering.
Download Comparison Reference Images >
| Target SSIM | # of iterations without denoiser | SSIM (without denoiser) | # of iterations with denoiser | SSIM (with denoiser) | Performance Gain |
|---|---|---|---|---|---|
| 90 | 0672 | 0.900133 | 0040 | 0.902118 | 16.800 |
| 91 | 0768 | 0.910315 | 0056 | 0.911695 | 13.714 |
| 92 | 0880 | 0.920296 | 0080 | 0.921151 | 11.000 |
| 93 | 1020 | 0.930079 | 0116 | 0.930014 | 8.793 |
| 94 | 1208 | 0.940086 | 0184 | 0.940246 | 6.565 |
| 95 | 1464 | 0.950108 | 0304 | 0.950132 | 4.816 |
| 96 | 1844 | 0.960032 | 0540 | 0.960038 | 3.415 |
| 97 | n/a | n/a | 1144 | 0.970034 | n/a |
The table above represents the exact values we measured on the final bistro scene we demonstrated at SIGGRAPH 2017.
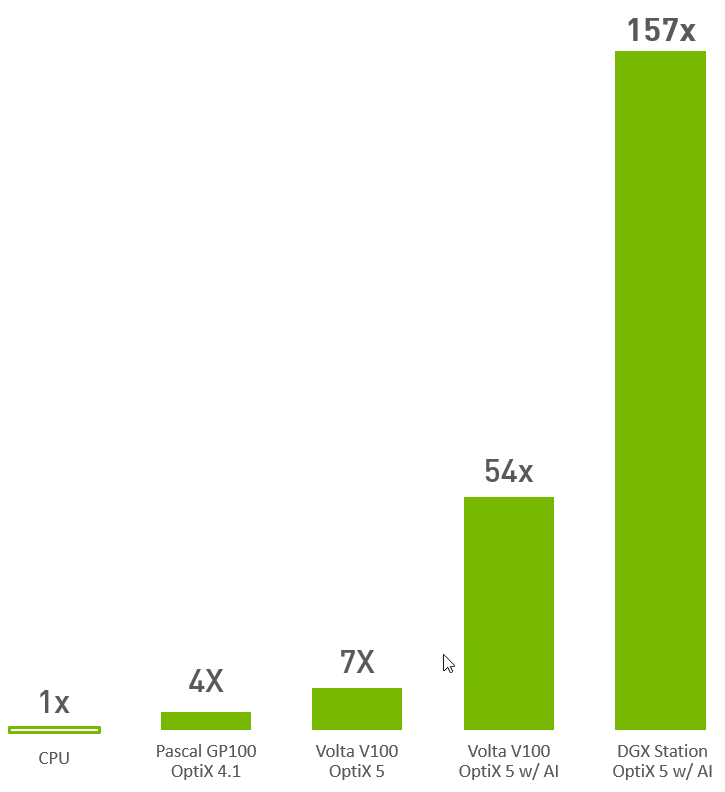
To generate the bar graph above we measured the wall time it takes to render the bistro scene to an image that will have an SSIM score of 0.93.
We learned the addition of AI delivers an additional 8x improvementand that on a DGX Station it was another 2.7x speedup from the single Volta V100.
The next step was to measure the improvement over CPU rendering. This posed a challenge since OptiX is a GPU focused product and a sample renderer for the CPU was not available. We turned to our partner Chaos Group, makers of the popular renderer Vray, which supports rendering on both CPU and GPU. Unfortunately, their benchmark utility does not provide a direct comparison so we asked Christopher Nichols, Director of Chaos Group Labs for his insight. He said in his experience it really depends on the content of the scene and how it was built. However, he’s seen performance gains average around 4x to 5x when moving from CPU to GPU. This provided a great starting point. For an additional data point we turned to Iray which uses an identical rendering algorithm on both CPU and GPU.
For our Iray test we ran our scene 4 times to ensure we were seeing consistent results. The goal was to measure approximately how much faster GPU rendering is compared to the CPU. Are we within the range mentioned by Chris? The numbers below show the time in seconds it takes to reach the given number of iterations. We then take that time and divide by the number of iterations to get the number of milliseconds per frame. We observed that the first numbers are higher than all the remaining numbers so we did not include those in our average. For the remaining results we calculate that Iray is on average about 4x faster than the CPU thus confirming Christopher Nichols’s observations.
| Iray on CPU | 2 x E5-2699 v4 @ 2.20GHz | |
|---|---|---|
| Iterations | Seconds to complete | milliseconds / frame |
| 132 | 109.273 | 82.78257576 |
| 127 | 97.011 | 76.38661417 |
| 127 | 96.991 | 76.37086614 |
| 124 | 95.397 | 76.93306452 |
| Iray on GPU | Tesla P100 | |
|---|---|---|
| Iterations | Seconds to complete | milliseconds / frame |
| 128 | 28.031 | 21.89921875 |
| 122 | 23.332 | 19.12459016 |
| 112 | 21.489 | 19.18660714 |
| 122 | 23.338 | 19.1295082 |
You can read more about OptiX here: OptiX Product page and learn more about AI with our online training from the Deep Learning Institute.