NVIDIA announces Nsight Graphics 2019.3! In this release, GPU Trace has been revamped with a new analysis mode, the Configurable Range Profiler is now the default view in the profiling activity, and the Acceleration Structure Viewer can now export acceleration structures for standalone viewing. For full details on the new capabilities in the 2019.3 release, see our full release notes!
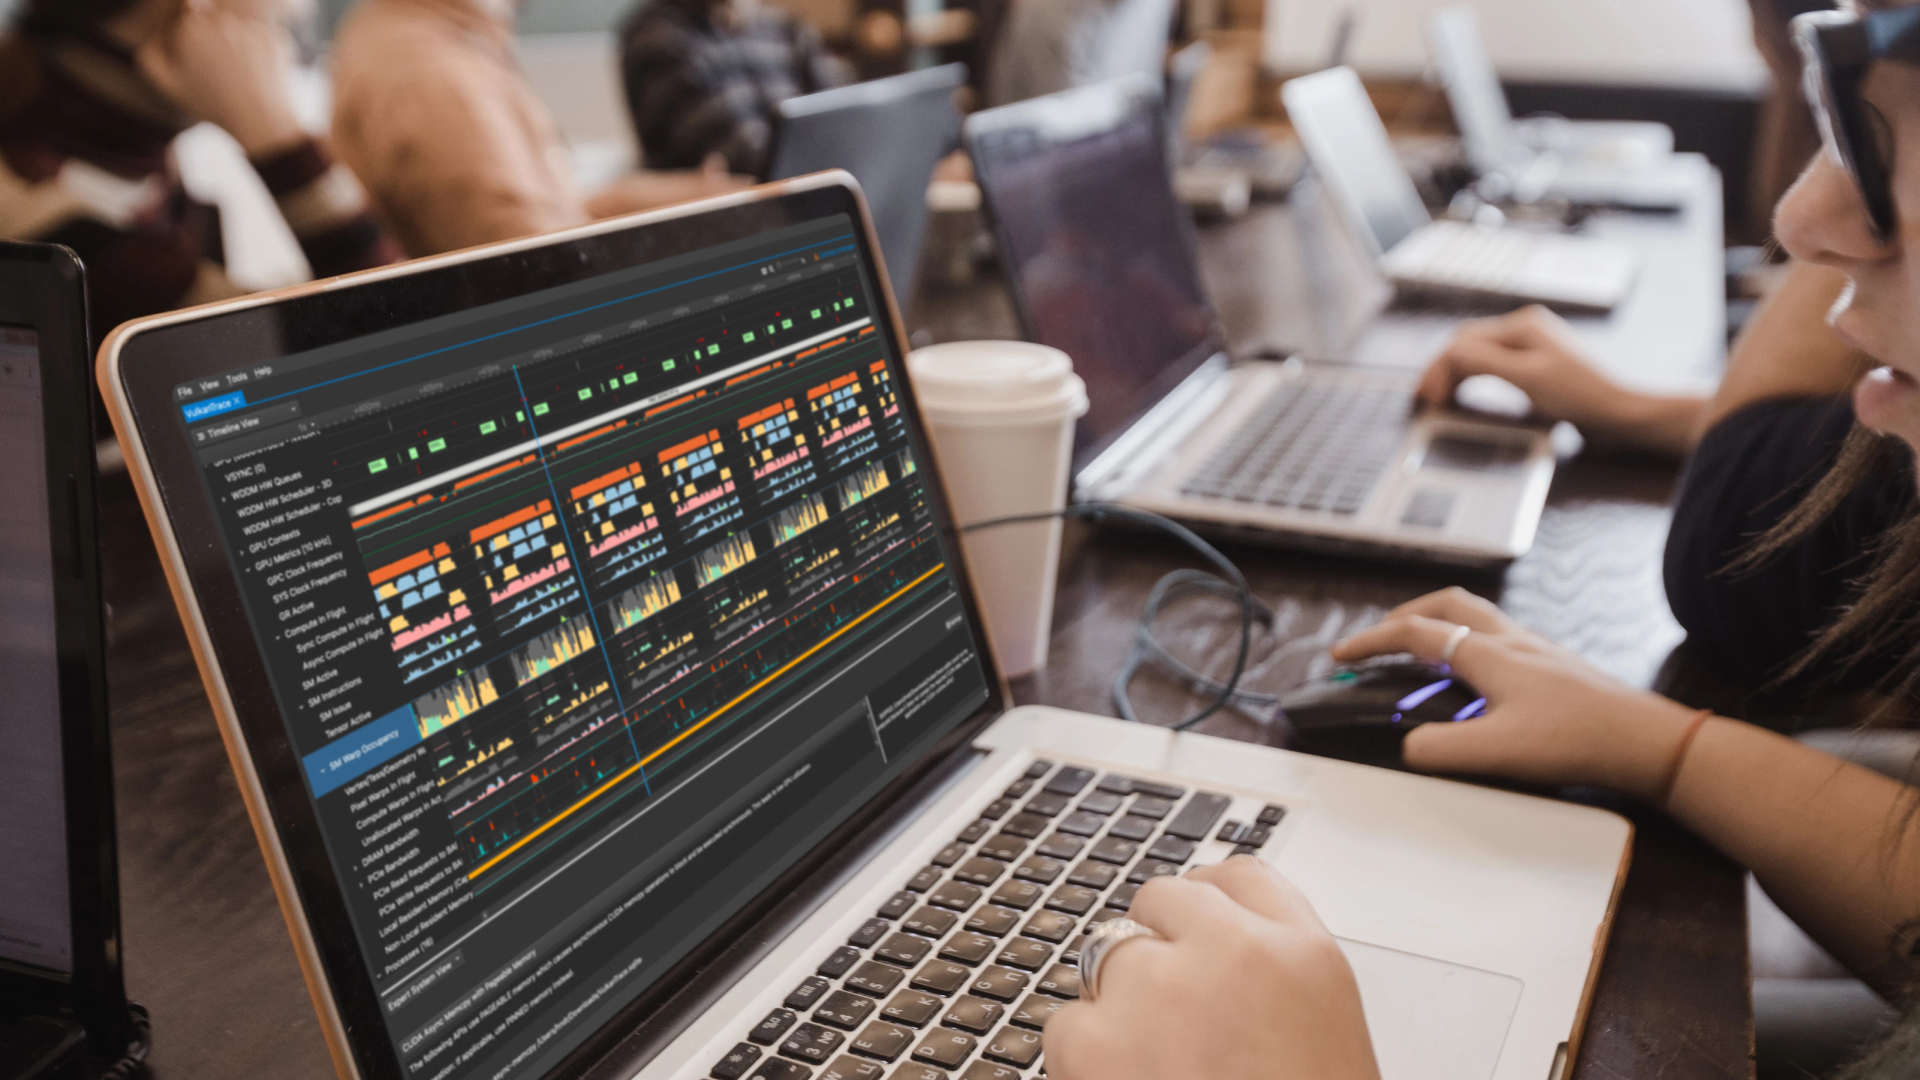
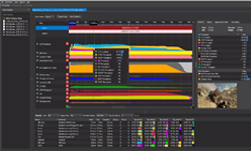
Made possible with the Turing architecture, GPU trace can now collect enough performance metrics to provide in-depth information about GPU throughput and utilization with minimal overhead. The Metrics Graphs timeline intuitively displays these performance metrics to help guide you through the profiling workflow on NVIDIA GPUs. Drill down into perfmarker regions and inspect hardware unit throughputs, SM occupancy, instruction and memory throughput, cache hit rates, and much more.

Additionally, the regime (performance marker range) table has been completely revamped. The new table helps you navigate to the most expensive perf maker region and quickly dive into the top throughput limiting units.

Previously a preview feature, the configurable Range Profiler is now the default view in the profiling activity. This new view enables you to customize the detailed sections within the range profiler. You can simply enable or disable sections, or write your own section files to fully customize the contents of each section. If you have used Nsight Graphics in the past, your configuration file will still use the Legacy Range Profiler View by default. You can reset the default window configuration by going to Window > Reset Window Layout.

Additionally, rules can be written into the sections files that create notifications in the UI when the rule’s conditions are met! This functionality is extremely helpful for automating your performance analysis workflow.

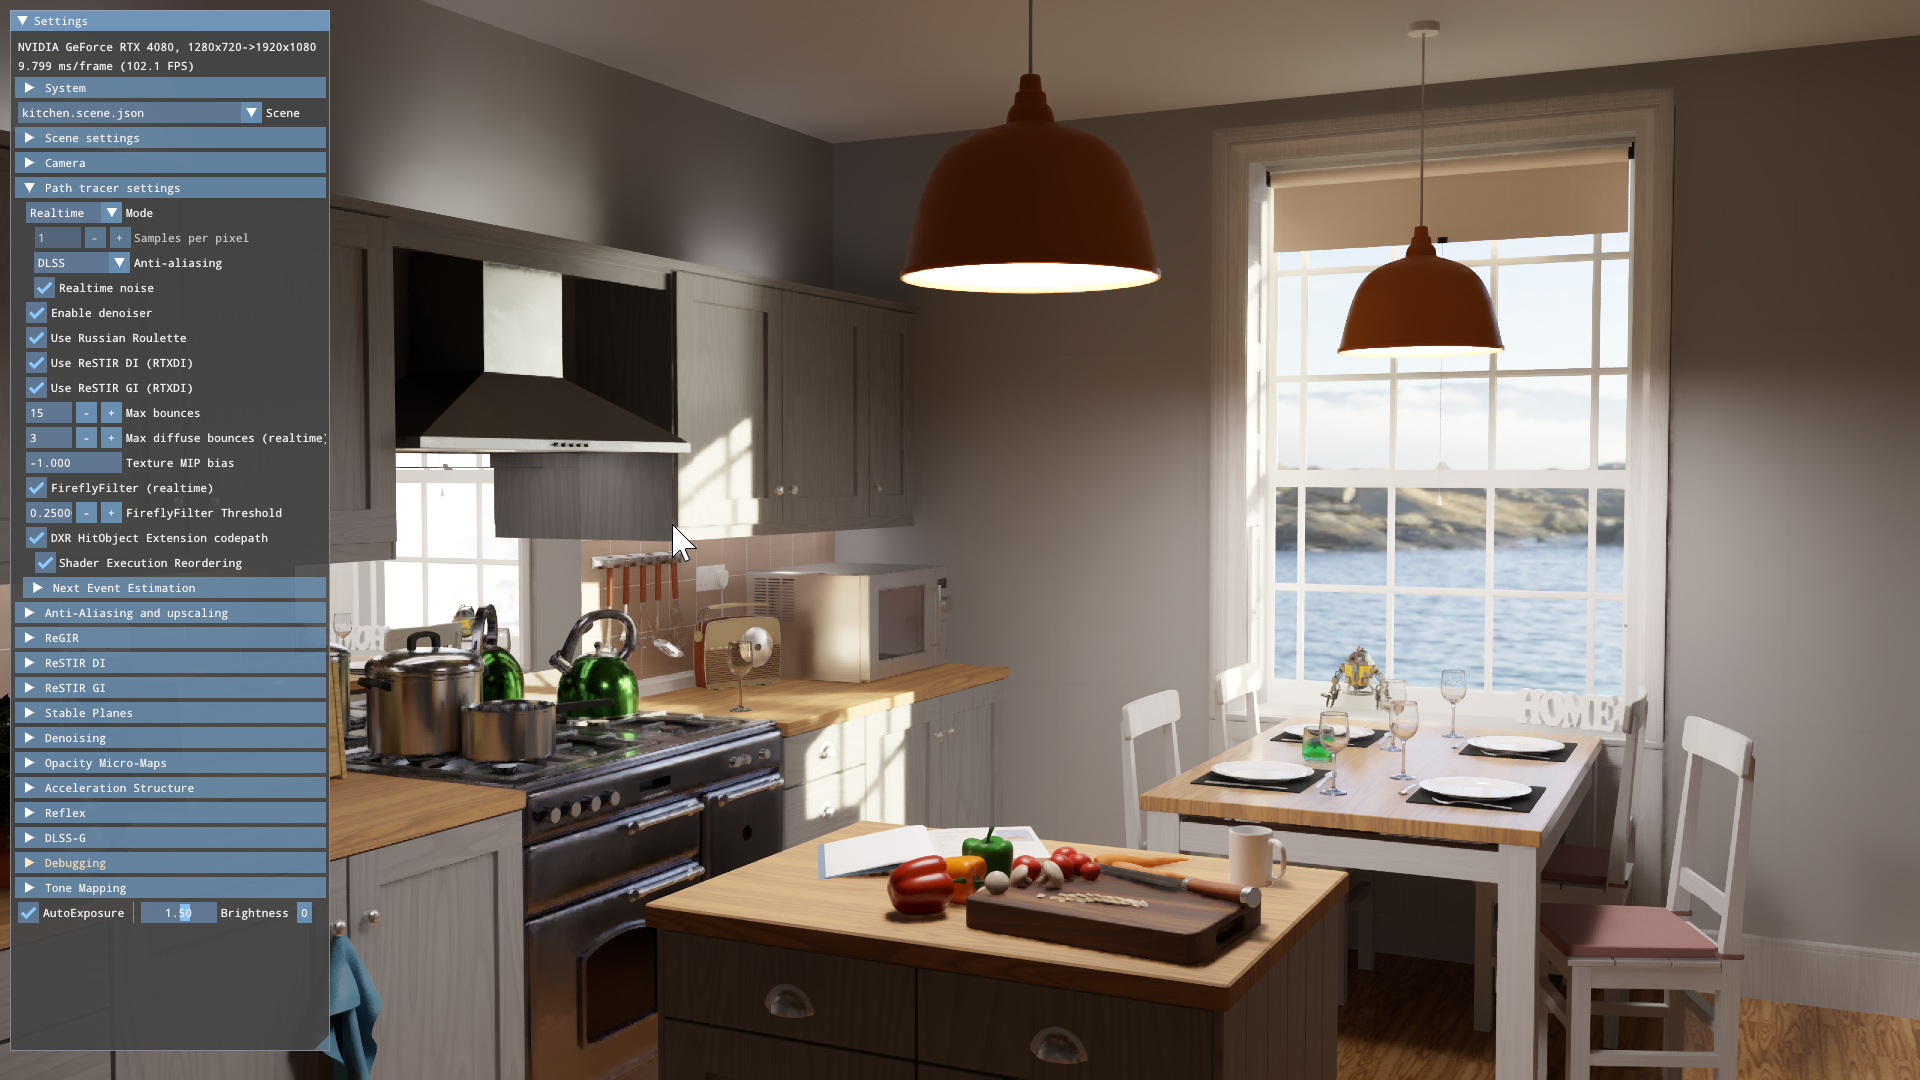
The Acceleration structure viewer can now export acceleration structures to a portable file. These acceleration structure files allow you to inspect the Acceleration Structure at a later time and can easily be shared with team members without needing a full nsight c++ capture or even the original application.

Additionally, the performance marker hierarchy inside the events view has been improved. Based on the selected event, the performance marker hierarchy is now visible at the top of the view. This feature is helpful when there are many events within a perfmarker region and can help avoid unnecessary scrolling.

We want to hear from you! We have added an integrated feedback button that lets you send comments, feature requests, and bugs directly to us with the click button. You can send feedback anonymously or let us know how we can follow up with you about your request!

Try out the latest version of Nsight Graphics today!