NVIDIA announces Nsight Aftermath – a new feature in the Nsight Graphics 2019.1 release. Nsight Aftermath gives developers the tools to solve one of the most frustrating and time consuming problems in the industry – GPU crashes and hangs.
With Nsight Aftermath, developers will save countless hours of debugging by easily inspecting GPU specific crash dumps.
In this alpha release of Nsight Aftermath, DirectX 12 applications are supported and we plan to expand API coverage in the future. Nsight Aftermath’s GPU crash dumps are similar to a CPU core dump and can be easily viewed in Nsight Graphics user interface that points users directly at the line of shader source code that caused the crash!
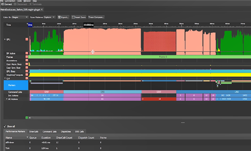
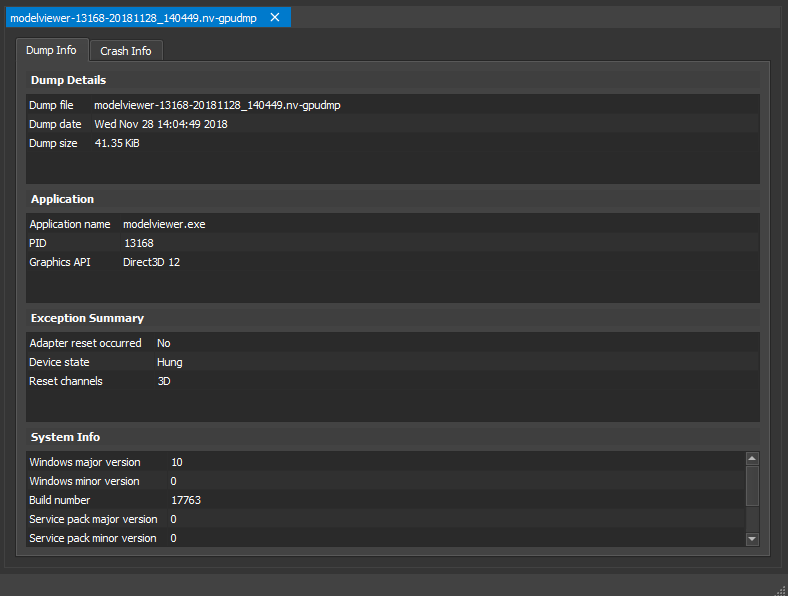
Exploring the the information rich crash dumps, we can see in the example below details about the dump, including the application that was running, the exception summary, and information about the system where the crash occurred.
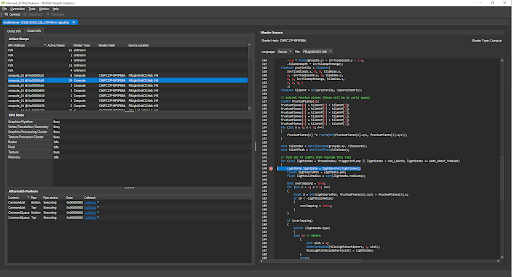
Digging into crash info tab, we can analyse why the crash occurred. In this tab, we can inspect the state of the GPU when the exception happened, the warps that were running on the shader units, and the source code associated with those warps. Additionally, a red marker in the shader source view indicates the exact line that caused the crash or hang, pinpointing the problem area.
Getting started with Nsight Aftermath is easy! Simply follow the instructions in our documentation to quickly get setup. If you are currently working through TDRs or GPU crashes on DirectX 12, give Nsight Aftermath a try and let us know if it helped solve your issue. Join our community on the Nsight Graphics forums.
Try out the latest version of Nsight Graphics with Nsight Aftermath today.
Related resources
- GTC session: Advances in Ray Tracing Developer Tools
- GTC session: NVIDIA NVentures Portfolio Showcase
- NGC Containers: GenAI SD NIM
- SDK: Nsight Aftermath
- SDK: Nsight Systems
- SDK: Nsight Visual Studio Edition