Three big NVIDIA Nsight releases on the same day! NSight Systems is a brand new optimization tool; Nsight Visual Studio Edition 5.6 extends support to Volta GPUs and Win10 RS4; and NSight GRAPHICS 1.2 replaces the current Linux Graphics Debugger.
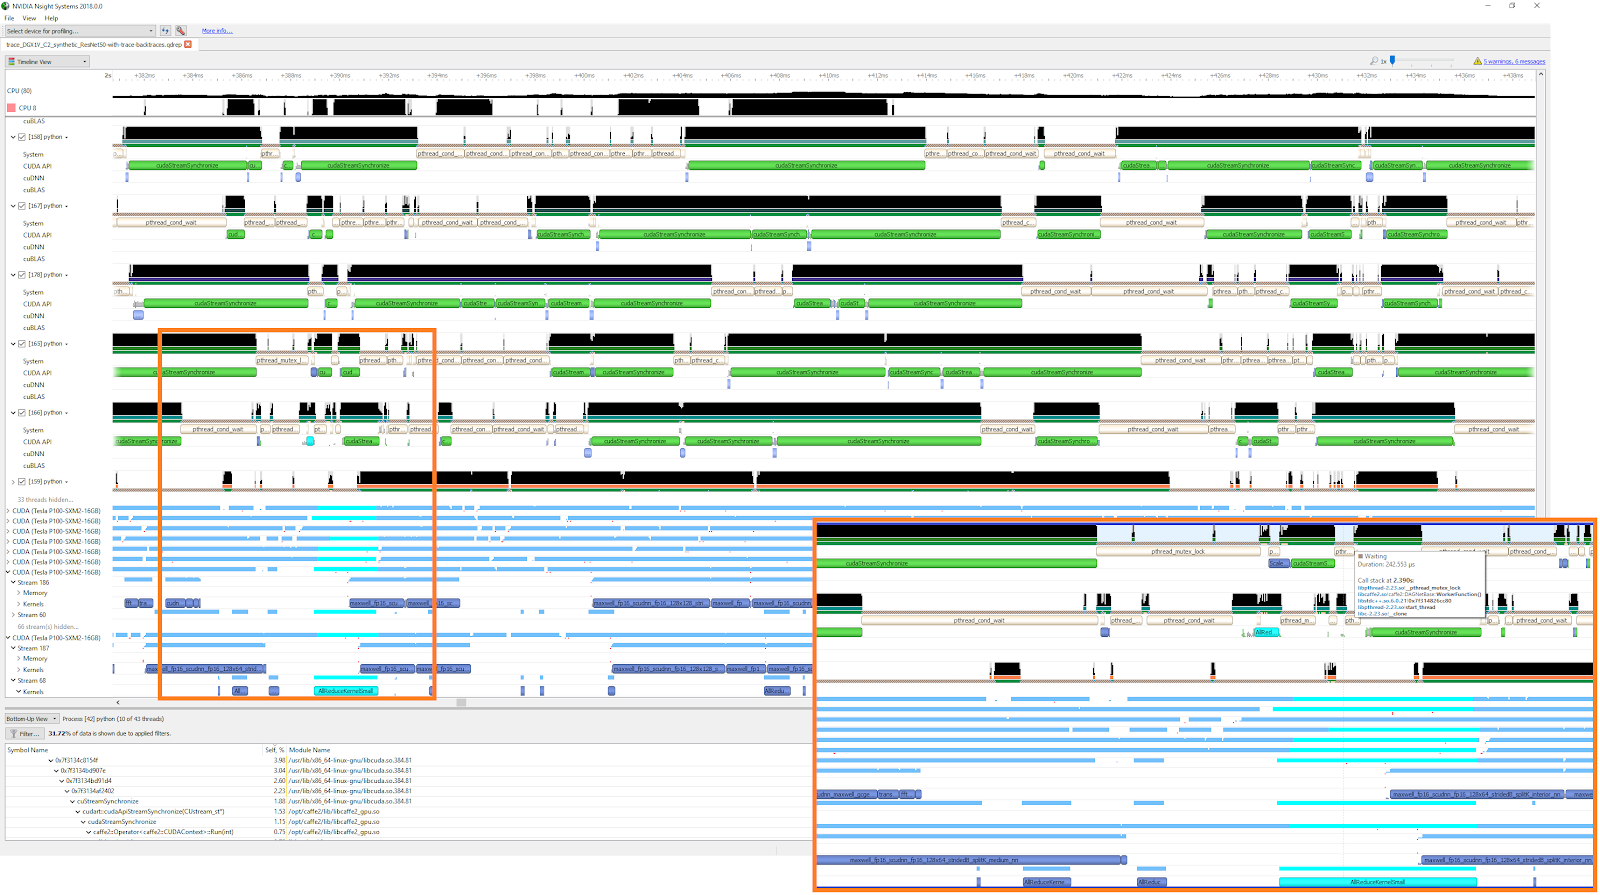
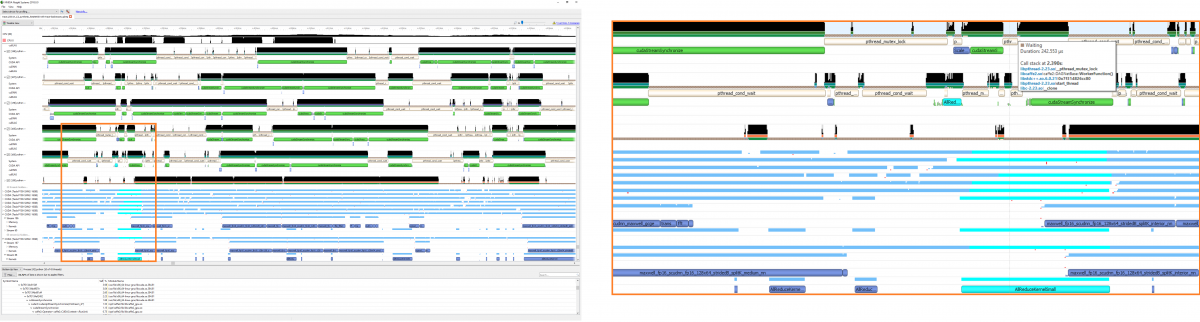
NVIDIA Nsight Systems is a low overhead performance analysis tool designed to provide insights developers need to optimize their software. Unbiased activity data is visualized within the tool to help users investigate bottlenecks, avoid inferring false-positives, and pursue optimizations with a higher probability of performance gains. Users will be able to identify issues, such as GPU starvation, unnecessary GPU synchronization, insufficient CPU parallelizing, and even unexpectedly expensive algorithms across the CPUs and GPUs of their workstations and servers. NVIDIA Nsight Systems can even provide valuable insight into the behaviors and load of deep learning frameworks such as Caffe2 and TensorFlow; allowing users to tune their models and parameters to increase overall single or GPU utilization.
Major Features
- View system-wide application behavior across CPUs and GPUs
- Investigate CPU-GPU interactions and bubbles
- NVTX user annotation support
- Lightning fast GUI capable of visualizing in excess of 10 million events
- Launch from the GUI or use the command line collection tool
- NV-Docker container support
- NVIDIA GPU Cloud support
For a complete overview of all Nsight System features and access to resources, please visit the main Nsight System page and download it today!
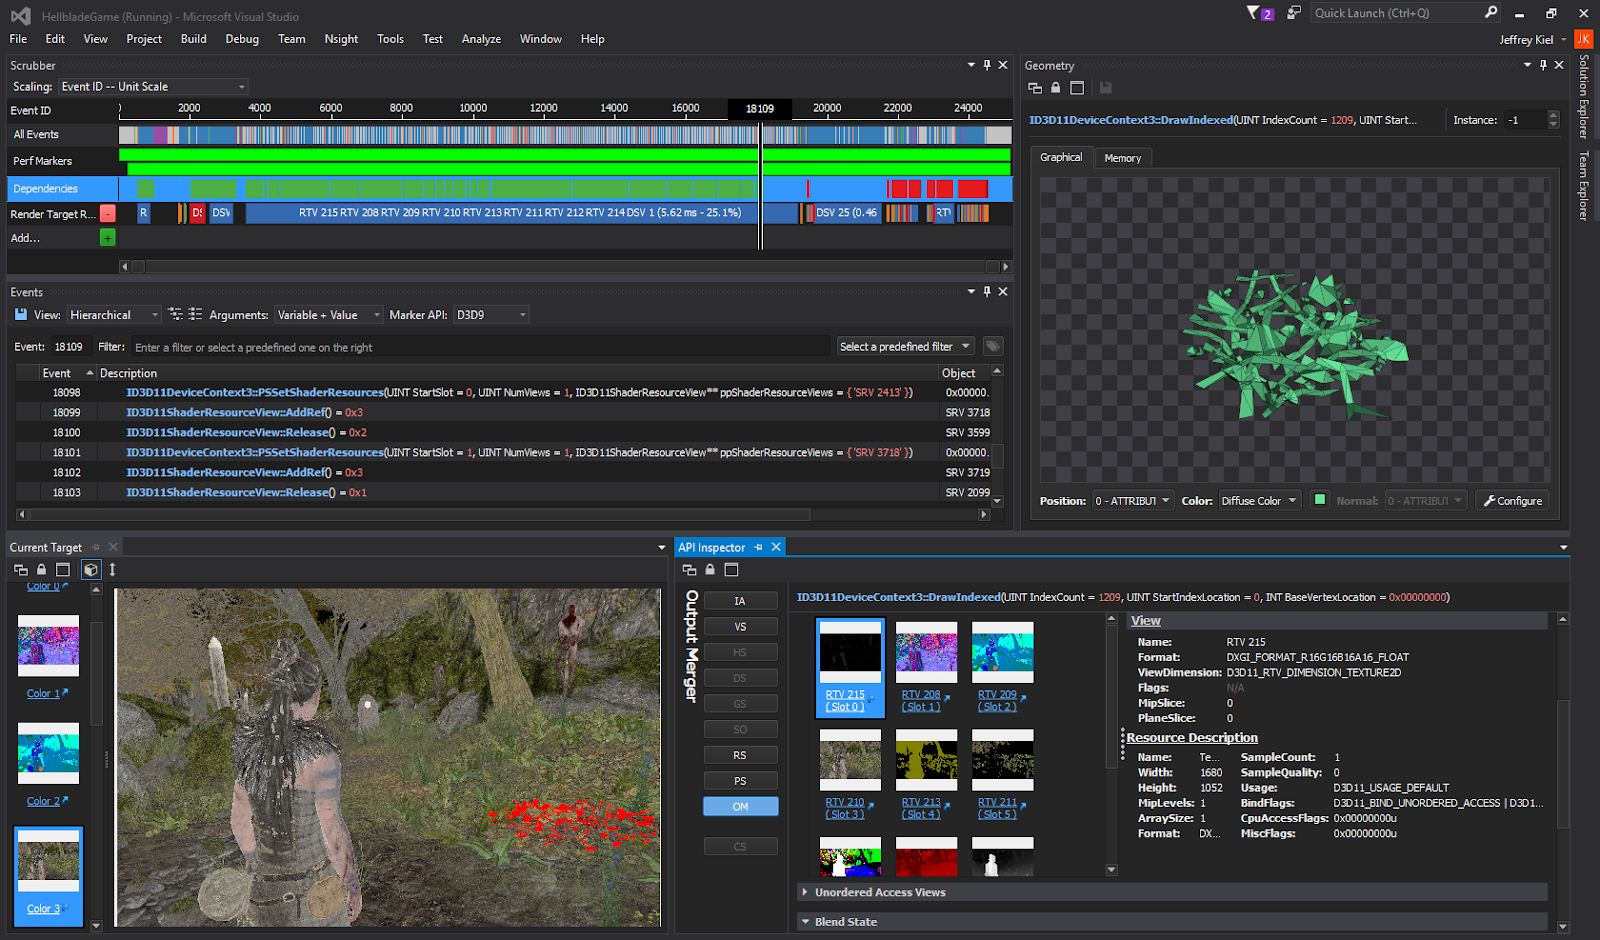
NVIDIA Nsight Visual Studio Edition 5.6 is now available for download in the NVIDIA Registered Developer Program.
This release extends support to the latest Volta GPUs and Win10 RS4. The Graphics Debugger adds adds .NET application and Vulkan 1.1 support as well as Range Profiler improvements. The Compute tools support the new CUDA 9.2 Toolkit, with the Next-Gen Debugger improving expression, register, and conditional breakpoint support and Next-Gen Profiler providing report transpose functionality.
Take a look at some of the highlights in the new NVIDIA Nsight Visual Studio Edition 5.6 release:
Graphics Debugging
- Support for the latest Volta GPUs for the GPU Frame Debugger, Performance Dashboard, and Range Profiler
- Support for the Win10 RS4 (when available
- .NET application support
- Vulkan 1.1 support
- Increased support for ID3D12Device2
- Reduced overhead when application is running pre-live capture
- Range Profiler continues to improve GPU throughput visualization and analysis
- Performance improvements
Compute Debugging and Analysis
- Support for CUDA 9.2
- Support for the latest Volta GPUs
- Win10 RS4 ready
- Next-Gen Profiler report Transpose now available
- Improved expression, register, and conditional breakpoint support in the Next-Gen Debugger
For a complete overview of all Nsight Visual Studio Edition features and access to resources, please visit the main Nsight Visual Studio Edition page and download it today!
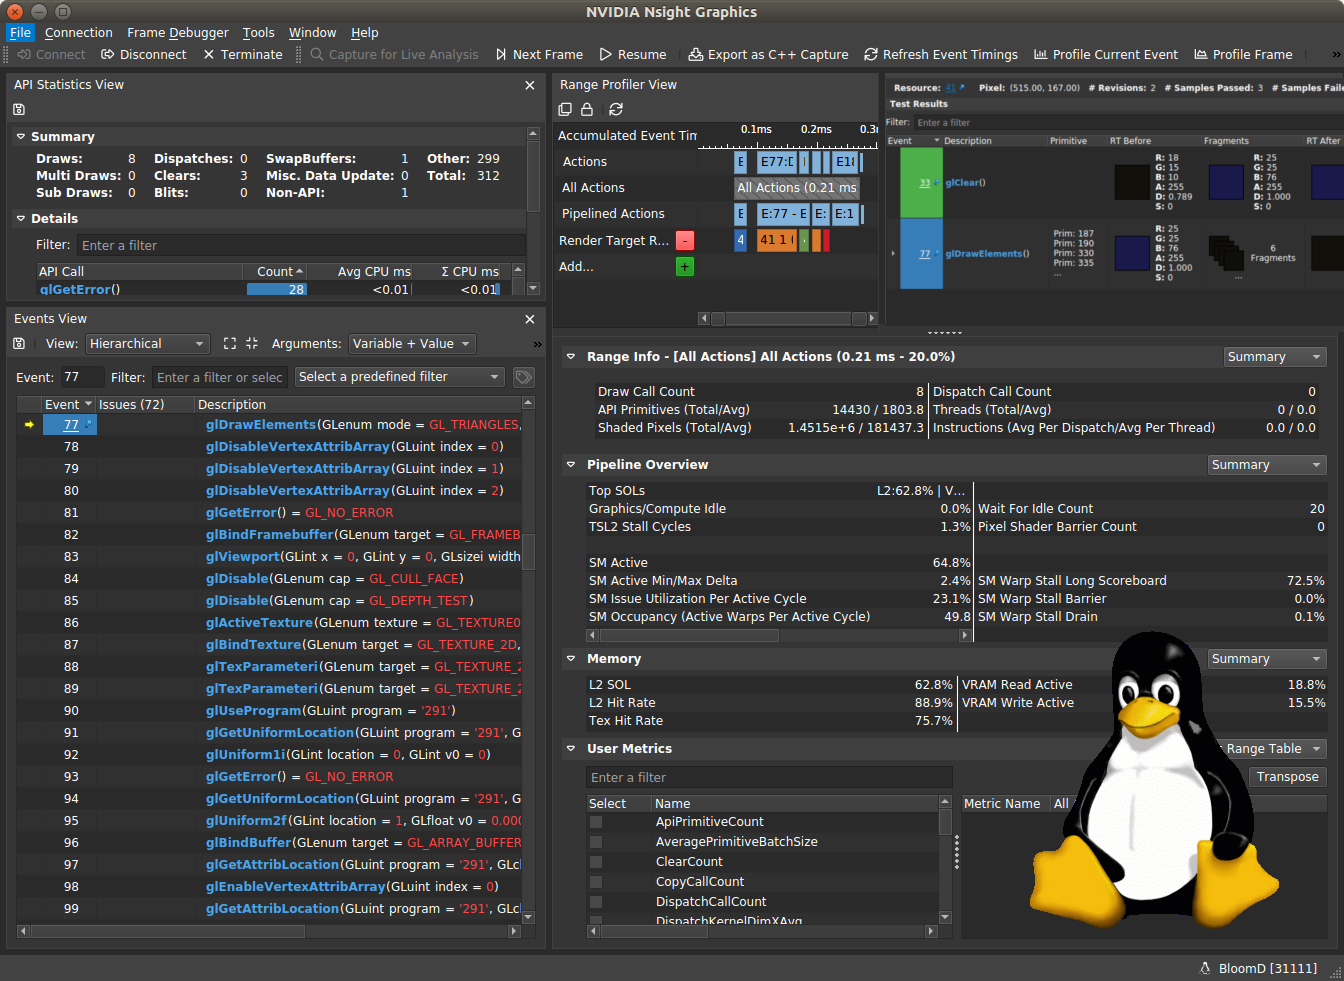
NVIDIA Nsight Graphics 1.2 expands upon the Nsight Graphics 1.1 feature set by delivering support for the Linux platform (Beta) and a common user request, a user-configurable memory view.
Take a look at some of the highlights in the new NVIDIA Nsight Graphics 1.2 release:
- New Platform: Nsight Graphics for Linux (Beta)
- Support for OpenGL debugging and profiling
- Support for Vulkan debugging
- Nsight Graphics for Linux subsumes all of the functionality of NVIDIA’s previous Linux Graphics Debugger
- Launching now in Beta, the full release will include improved launch and attach functionality
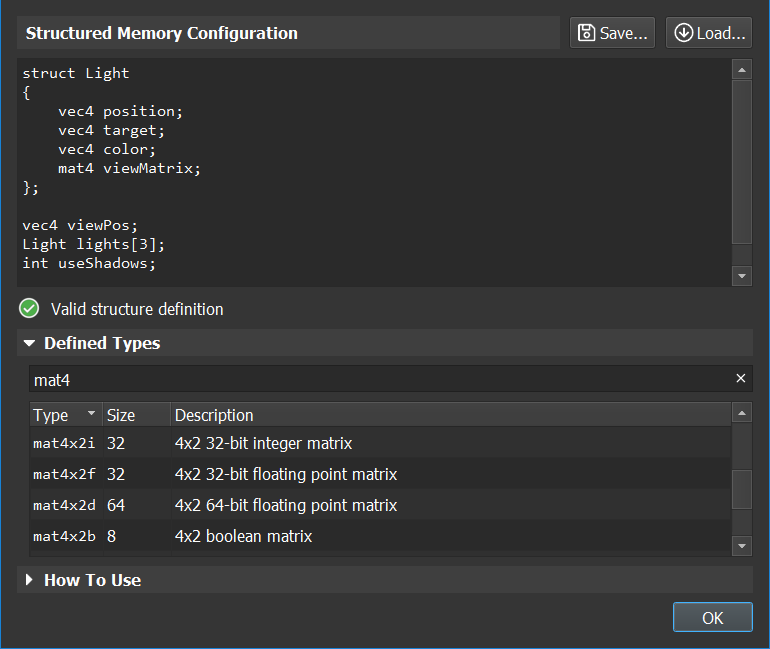
- New Feature: User-Configurable Memory Viewer
- Applies an automatic structure to resources when context is available
- Allows for full customization of structured user types
- Allows for customization of the columns displayed
- Built-in help to explain how to use the view.
- New Feature: C++ Capture Support for DXR applications
- Improved: Full support for RS2 D3D12 SDK
- Improved: Includes several bug fixes and application compatibility fixes
For a complete overview of all of Nsight Graphics 1.2 features and access to resources, please visit the main Nsight Graphics page and download it today!
Five Cool Features You Didn’t Know You Needed
Nsight Graphics 1.2 will enable you to debug, profile, and export frames… but you already knew that. In this post, we wanted to surpass your expectations by detailing five features didn’t know you needed… but you’ll find indispensable in retrospect.
- The Range Profiler gives you immediate feedback on what GPU subunits are not achieving maximum throughput. You can also edit your shaders on the fly and see the impact of those changes on the frame rate and/or Range Profiler results. Instead of guessing where your GPU subunits are hitting inefficiencies, you can just pop up the Range Profiler and see what’s going on.
- You can search for API calls of your choice in the Events View, then create a custom scrubber row to scrub just those events. A similar capability is provided with shaders — create a row to scrub all draw calls using a specific shader. It makes scrubbing for the data you care about that much easier, trimming your analysis with precision.
- You can track both resource revisions and resource consumption of your data to understand where your data is used and how it changes. The Resources View shows a thumbnail for each resource revision and offers an ability to create a scrubber row at each event in which this resource is consumed. Think of it as a strategic heat map, giving you more control over how data is used, changed, and consumed.
- Pixel History shows all fragments generated for a given pixel, both passed and failed. For failed fragments, you can see the reason why it failed, like being z culled. This will take the maddening guesswork out of failed fragments, allowing for faster fixes.
- A captured frame can be exported to disk, generating an editable C++ project that renders the original frame, and allows for easy experimentation. Sometimes, a lot can be learned by looking at a frame in isolation.